
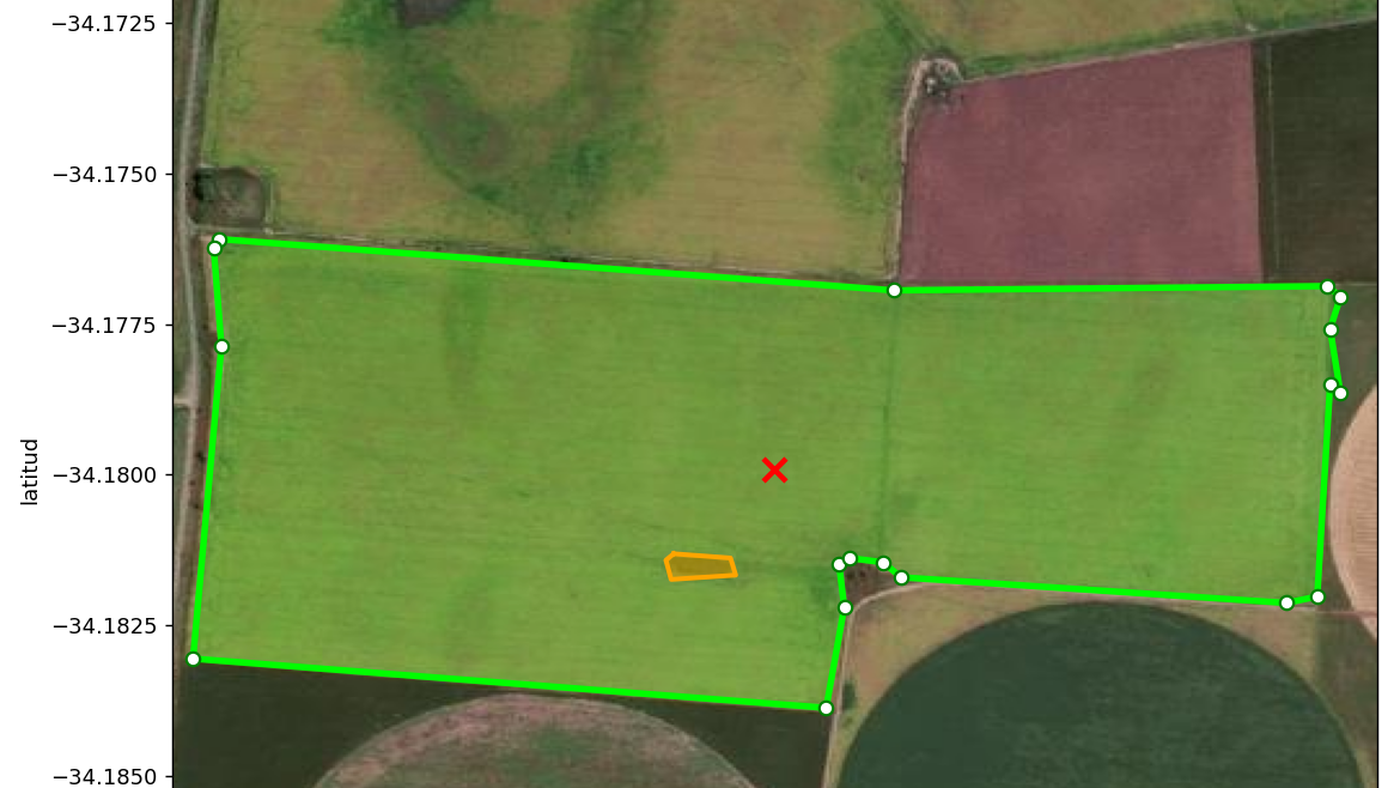
In an agricultural insurance company, almost everything is decided on a geometry. The premium is calculated on an area. Accumulation is controlled on a position. The claim payment is justified on a perimeter.
ClimaVista pioneered the georeferencing of risk portfolios in Argentina. Before that shift, a company's exposure was read from locality names and declared areas; today it rests on real fields, located and measured. The sector gained a considerable improvement in portfolio quality from it, and that foundation — which we retain and enrich from one season to the next — is now established.
It nonetheless remains incomplete, and it is worth saying why. Portfolio geometry is still partial — not through negligence, but for want of information at the precise moment it would be needed. Not every grower has the KML or KMZ files of their fields. And tracing a polygon by hand during the underwriting interview takes long minutes, in front of a waiting client: it slows the sale down, and sometimes loses it.
This is a commercial constraint before it is a technical one, which is why it persists. An underwriter faced with a choice between an exact geometry and a signed contract will choose the contract. It is precisely to remove that choice that we designed Point-to-Polygon: during the interview, the operator drops one point per field, and the system computes the polygon without interrupting the sales process.
Let us first look at what this step costs when it is not tooled.
The calculation nobody runs
Take a modest portfolio: 4,000 policies, four fields per policy on average. That makes 16,000 fields to delineate every season. A trained operator traces a decent polygon in five to eight minutes if they know the area, and longer if they must first locate the field from an approximate address or a verbal description.
Sixteen hundred hours is just under one full-time equivalent for the year, spent on a task that produces no analytical value whatsoever. But the direct cost is the least troubling part of the problem.
The real cost lies elsewhere, in three effects that time spent does not measure.
The first is a precision cost. It is often said that without geometry the contract cannot be priced. That is untrue — and that is precisely the problem. In practice, many agents accept partial information rather than lose the business, and the contract goes through anyway. The one who loses is not the agent: it is the company, which ends up insuring fields without knowing where they are. It is insuring a car without knowing its model, or a house without knowing its address.
That imprecision has a name in the field: the moving field. When a field has not been georeferenced before the loss, its position stays negotiable at claim time — and it turns out to sit, with unsettling regularity, exactly where the hail fell. It is never the undamaged fields that move.
The second is a quality cost. A hand-drawn polygon is approximate by construction. The typical gap we measure between a manual trace and the real outline of the field sits between 5 and 15 % of the area, and more on fields with irregular edges. That gap is not neutral: it bears on the insured area, therefore on the premium, therefore on the indemnity.
The third is a dispute cost. At claim time, a contestable area becomes a contested area. When the policyholder declares 42 hectares and the polygon records 38, the discussion is no longer settled on data but on bargaining power, and usually to the insurer's disadvantage.
What the satellite already knows
The important point is that this information does not need to be produced: it already exists.
The boundaries of an agricultural field are not invisible. They are drawn by the vegetation itself. Two neighbouring fields rarely carry the same crop, and when they do, they are not sown on the same day, nor fertilised at the same pace, nor harvested at the same moment. On a series of NDVI images — the vegetation index computed from the red and near-infrared bands of Sentinel-2 — that difference shows up as a sharp discontinuity.
A single image is not enough: a cloud, a terrain shadow or a shared phenological stage can temporarily erase the boundary. This is why we work on a quarterly series rather than a single acquisition. Over a quarter, each field follows its own growth trajectory, and it is those diverging trajectories, more than the absolute value on any given day, that reveal the boundary reliably.
The practical consequence: one point inside the field is enough. A click on the map, or GPS coordinates taken by a field technician standing inside the field. The rest — propagation to the boundaries, closing the polygon, computing the area — is determined by the satellite data.
That is the Point-to-Polygon principle: the operator no longer draws, they point.
The resulting polygon is more than an outline. The same reading of the imagery makes it possible to subtract what is not cultivated: a stand of trees, a pond, a building, the footprint of a road or a track. Within a closed field, these regularly account for several per cent of the area — hectares on which a premium is charged even though they carry no crop to indemnify. What comes out of the calculation is therefore not the area of the field, but the agricultural area actually sown, the only one that is insurable.
What it changes in underwriting
The most visible gain is time. A five-to-eight-minute operation becomes a matter of seconds. Across the 16,000 fields in our example, the order of magnitude drops from 1,600 hours to under 40.
But the deeper transformation lies elsewhere. Once georeferencing becomes instantaneous, it stops being a deferred production step and can move up into the commercial journey. It becomes possible to georeference during quoting rather than after acceptance: the grower indicates their fields, the area appears, the premium is calculated on the real geometry, and accumulation control runs before commitment instead of after the fact.
A third effect appears from the second season onwards, and it is probably the most underestimated. Geometry is not recomputed every year: it is retained. A returning policyholder comes back with their fields already traced, already measured, already tied to their loss history and their past NDVI trajectories. Renewal is no longer about redoing the work, but about checking what changed — a field sold, a crop rotation, a field added. And for that added field, one point is enough.
This is what separates a georeferenced portfolio from a portfolio that is permanently being georeferenced. On a loyal client, underwriting effort decreases from one season to the next instead of repeating identically, and the accumulated history becomes an asset in its own right: it is what refined pricing and long-run risk reading rest on.
And for a policyholder arriving with no history, the precision of the geometry changes the very nature of the commitment: the company no longer takes a declared risk, it takes a measured one. A correctly located field can be traced back through time — NDVI trajectories from previous seasons, climate events recorded on that exact point — which allows a diagnosis of the conditions prevailing before underwriting, before the company has committed at all.
It is also what closes the door on date fraud. Damage that occurred before the policy took effect remains written in the imagery: it can no longer be shifted by a few days to fall on the right side of the contract. Geometry therefore serves not only to know how much is being insured, but to know the condition of what is being insured at the moment of insuring it.
That is a difference in kind. An insurer who controls accumulation afterwards discovers their risk concentration once it is already underwritten. An insurer who controls it at quote time can still decide not to take the risk, or to take it at a different price.
What it changes in claims
The second half of the value plays out at claim time, and it is less obvious.
A loss adjuster in the field works in conditions that make manual tracing almost absurd: in bright sun the screen is unreadable; with gloves or dirty hands the finger is imprecise; under the pressure of several visits in a day, nobody takes the time to place fifteen vertices carefully. The result is rushed polygons, or worse, areas reconstructed from memory back at the office in the evening.
With a single point, the adjuster records their position inside the field and the polygon builds itself. The perimeter they document is the same geometric object as the one from underwriting, which finally makes a direct comparison possible between what was insured and what is being assessed.
And that comparison is precisely what underpins a defensible decision. When the area declared at claim exceeds the area underwritten, the gap becomes immediately visible, measurable, and documented by a source independent of both parties. It is no longer the policyholder's word against the adjuster's: it is a timestamped satellite geometry that both can examine.
The limits, which are worth knowing
No automatic method is universal, and it would be dishonest to present this one as such.
Detection performs poorly on very small fields, below roughly one hectare: the resolution of Sentinel-2, ten metres per pixel, does not leave enough pixels to cleanly separate an interior from an edge. It is also fragile on fields with mixed crops, where the discontinuity being sought simply does not exist, and in areas where persistent cloud cover reduces the number of usable images across the quarter.
In those situations manual tracing remains necessary — which is why the tool does not remove it but reserves it for the cases where it contributes something. The right way to measure the service is not "does it replace the operator?" but "what share of the volume does it handle without intervention?". On the row-crop portfolios where the service is in production, that share is above 85 %.
A building block, not a product
We rarely present Point-to-Polygon as a product in its own right, and that is deliberate. A reliable geometry is only interesting for what it enables next: accumulation control in USD per contract, per-field topography, comparative NDVI analysis before and after an event, GIS export to the reinsurer's systems.
That is the logic of the platform as a whole: every stage of the contract produces the data the next one needs, with no break and no re-entry. Georeferencing is simply the first link — the one that, done badly, weakens all the others.
This logic nonetheless obliges nobody to adopt the platform. A company that already runs its own underwriting and claims systems consumes the service through an API: it sends a point and a date, and receives back the polygon, the area net of non-cultivated ground, and the metadata documenting the computation. The building block slots into what exists without forcing a migration or a change of tooling on the teams, and the result flows straight back into the system where the decision is made.
The service is available on the ClimaVista platform and through the API, for integration into insurers' core systems.