
Warning a policyholder before a storm gives them time to move the car under cover, unplug their appliances, shelter their livestock. In Europe, Allianz turned this into a large-scale service: after trials with 15,000 customers, its SMS weather alerts were extended to 1.1 million policyholders in Germany and more than 150,000 in Switzerland. In these pilots, 86 to 96% of the customers warned took protective measures, and between one in three and one in two say they avoided damage. The World Meteorological Organization sums up what is at stake: 24 hours' notice can cut damage by 30%.
Investing in forecasting is investing in the technical result
For an insurer, every damage avoided is a claim that is not filed, not assessed, not paid. Early warning therefore acts directly on claim frequency, whereas most prevention levers require works or equipment at the policyholder's premises. The cost stays marginal: one message sent at the right time, to the right locality.
This lever has one condition: reliability. An alert that goes off too often for nothing ends up ignored, and an alert that misses storms protects no one. The whole point is to know, with figures, what an alert is worth before entrusting it to thousands of policyholders.
A forecast that improves because it is verified
Our lightning alerts are recomputed every hour and checked continuously against the flashes actually detected by satellite, locality by locality. This verification is not a one-off audit: it is the engine of our continuous improvement.
It showed us where the previous version was too cautious, which data sources added the most, and at which horizon each was useful. It led us to integrate new sources, to separate two forecast horizons and to define two alert levels. Each change is tested on historical data before going live, then monitored alongside the version in service.
Today's results on 20,000 localities in Argentina
At 24 hours, global forecast models can tell where storms are likely, but not to the hour. The 24 h alert is therefore advance notice: the day and the area, with level 2 for a forecast storm and level 1 for a watch situation. Over 274 verified days, it anticipated 60% of days with lightning, and 75% of its level 2 alerts were indeed followed by flashes within 20 km of the locality.
The 2 h alert is for taking action. It combines the flashes observed around the locality in the past hour with the very short-range forecast: an active storm 25 km away is moving, and that observation is what gives short-range accuracy.
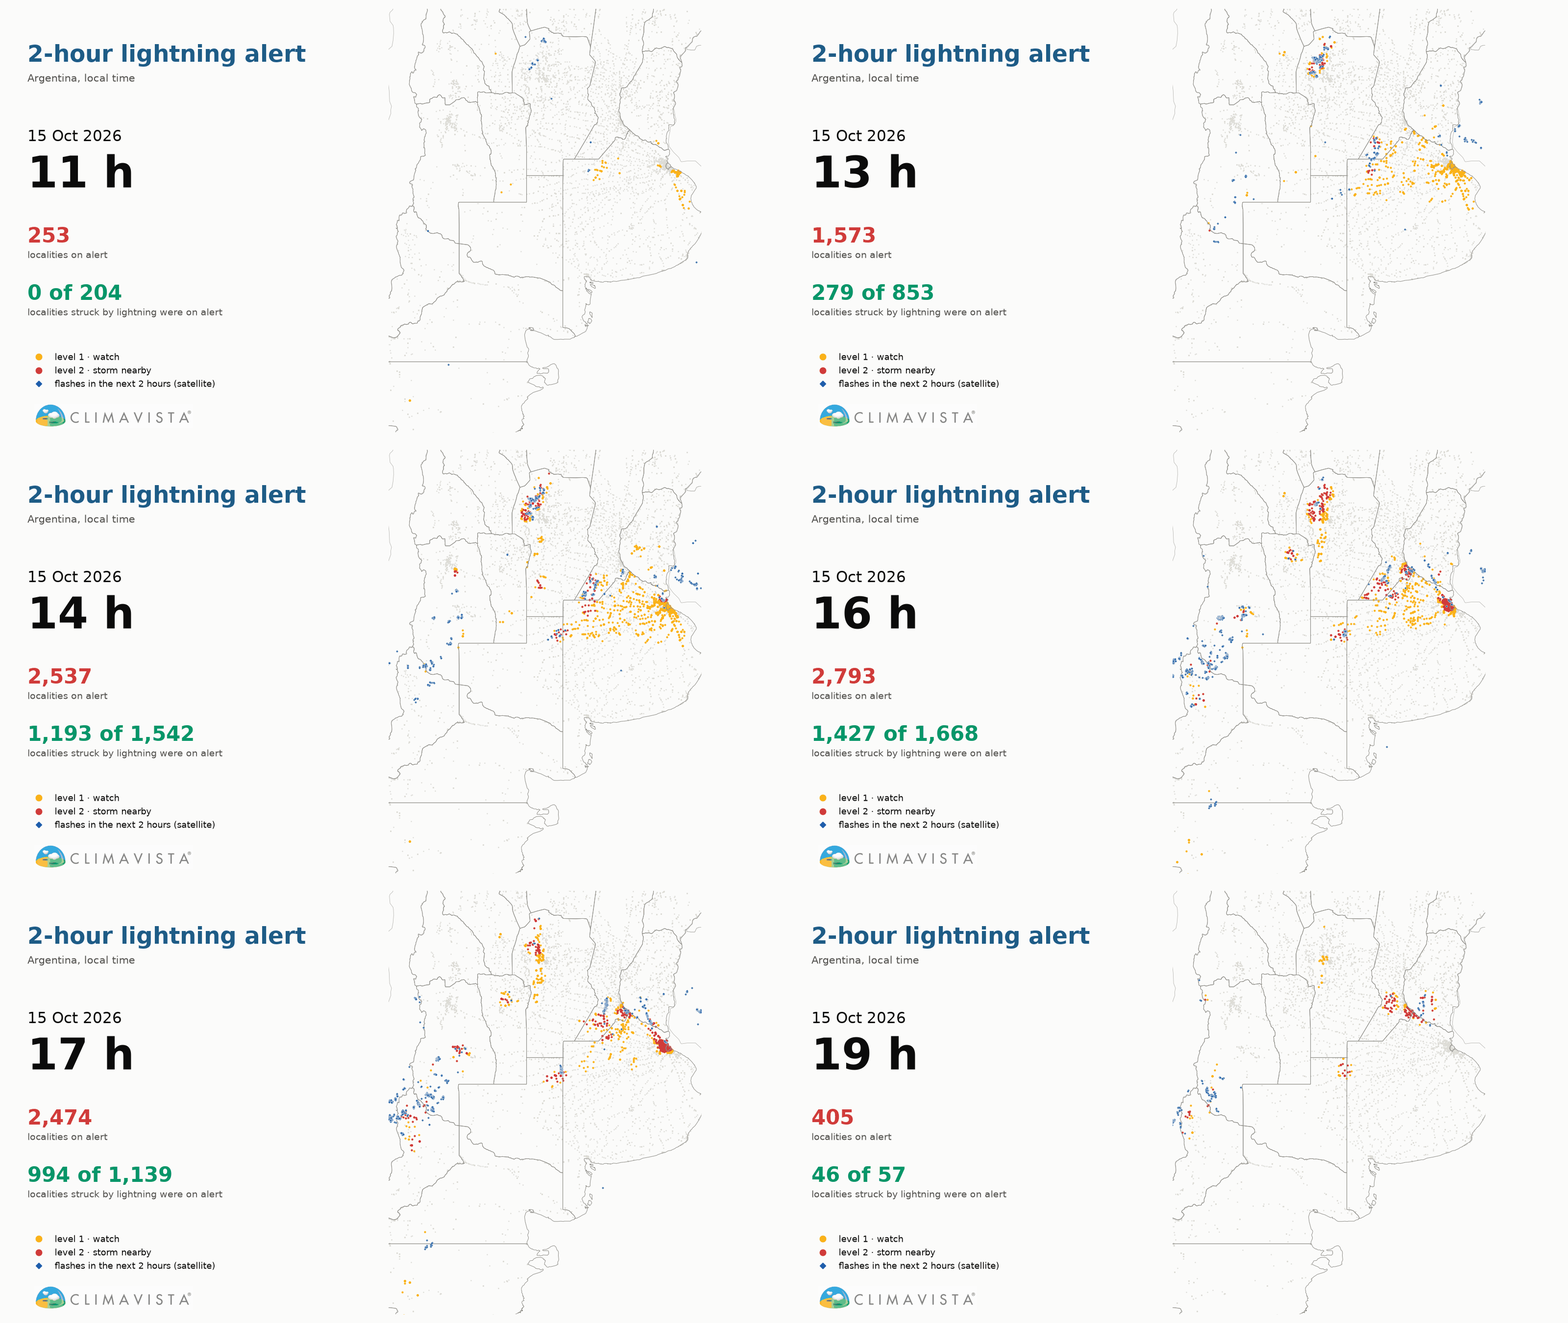
At night, between midnight and 6 am, the 2 h alert anticipates 70% of situations, when nobody is watching the sky. On 15 October 2026, between 4 pm and 6 pm, 1,427 of the 1,668 localities struck by lightning were on alert, 1,145 of them already at level 2.
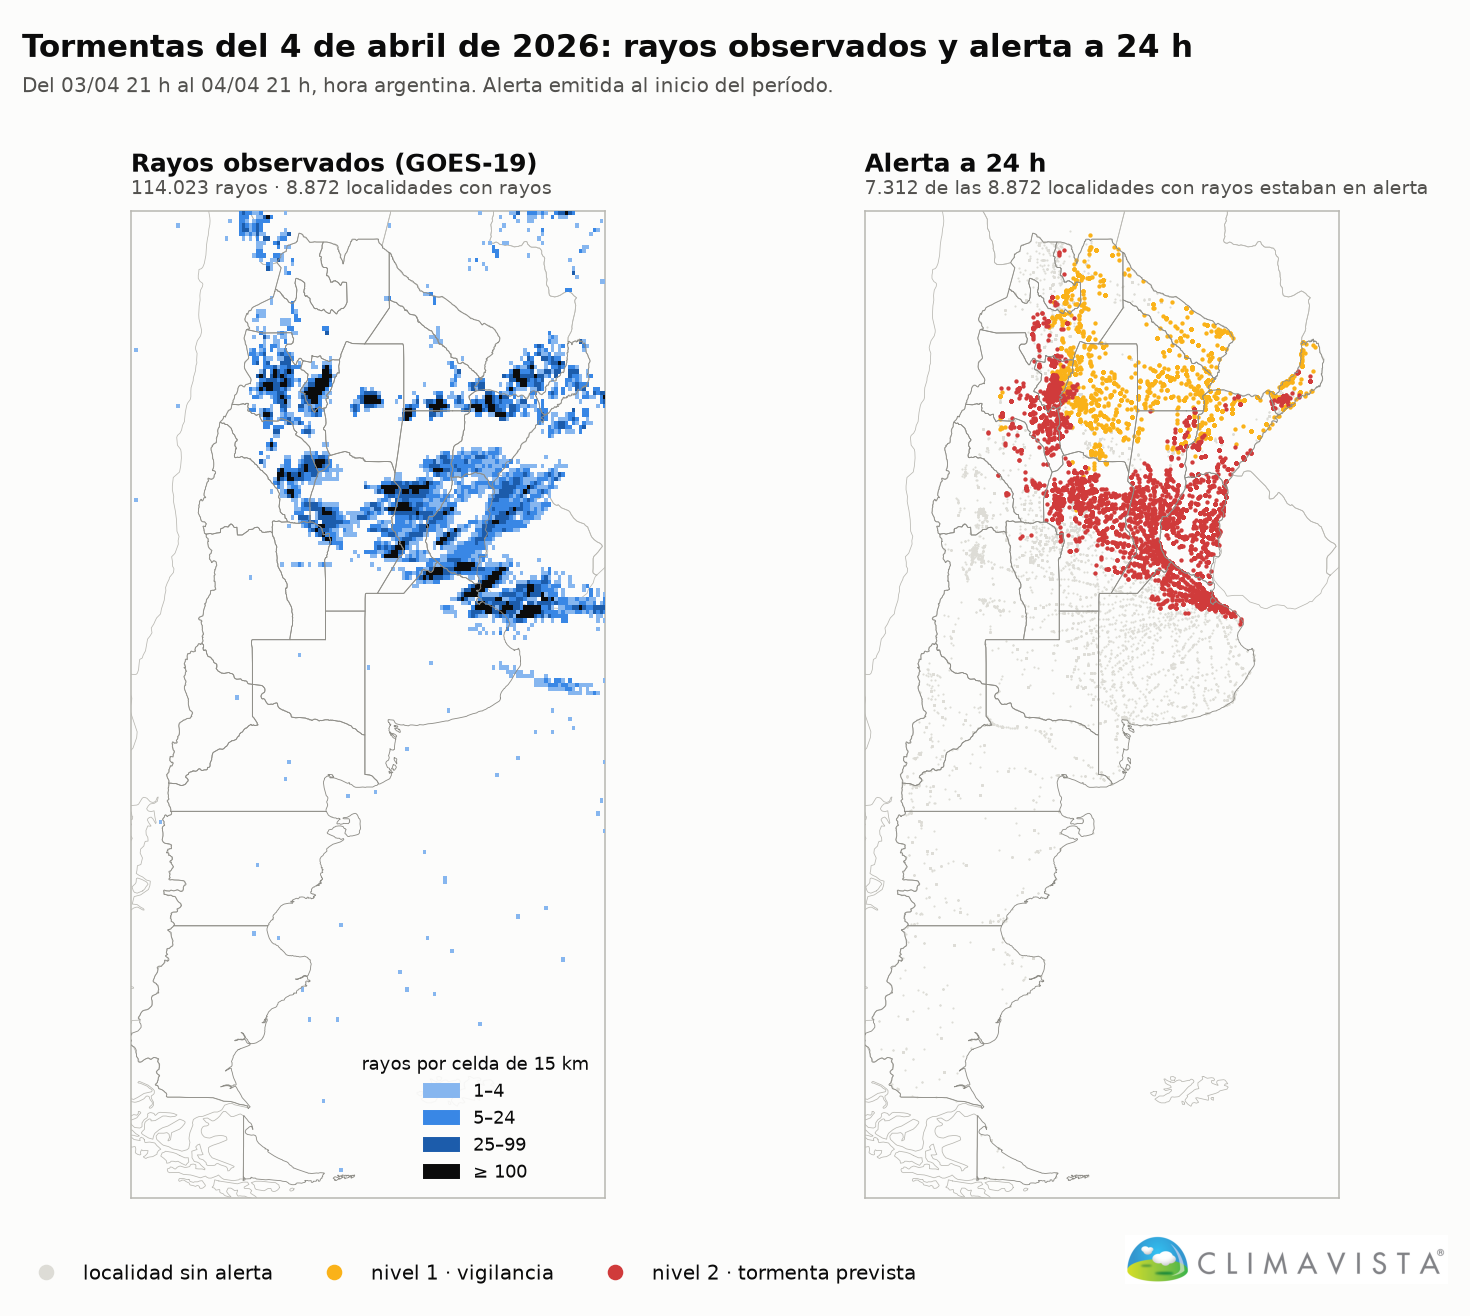
The two levels call for two kinds of action. At level 1, low-cost steps: inform, prepare. At level 2, the heavier measures: unplug sensitive equipment, bring machinery in, move livestock away from fences and isolated trees, suspend outdoor work. This gradation rests on what verification measures: at 2 h, two out of three level 2 alerts are followed by flashes within 20 km, which makes it the right level to trigger the most costly decisions. At 24 h, anticipation is strongest in the north of the country, where most localities see more than 60% of their storm days anticipated; in the central region, the observation-based 2 h alert takes over.
Alerts are delivered by API and fit into the insurer's own tools: app, email, SMS or messaging. The company can also entrust the sending to us: we then send the alerts directly to its policyholders, on its behalf, with no development on its side.
Observed lightning, available in ClimaVista
The data used to verify the alerts are also made available to teams. In the ClimaVista platform, flashes detected by satellite (NOAA) are available across the whole territory, day and night, about three minutes after the flash, with history back to November 2025.
The user enters a point, by clicking on the map, typing an address or coordinates, and a period. The system shows the number of flashes per day within 10 km, then, for a given day, the map of all flashes, the local time of each one and the hourly series with the time of the peak.
Two safeguards make this record usable in a claim file: a day without satellite data is shown as "no data", never as "no lightning", and a partially covered day is flagged. The report prints in one click and can be attached to the claim file.
Validating a lightning claim through historical intensity and polarity analysis
Some claims need more than a daily count. For wind farms, we have for several years been carrying out historical analyses of lightning intensity and polarity: strike density around each turbine, split between positive and negative strikes, peak current, hours of activity and distances to structures.
These analyses serve claims assessment first: establishing the electrical activity actually observed around a turbine on the date of a claim on a blade, nacelle or control system, and checking that strike intensity is consistent with the reported damage. They also serve pricing, based on the measured exposure of the site, and the siting of projects in exposed areas.
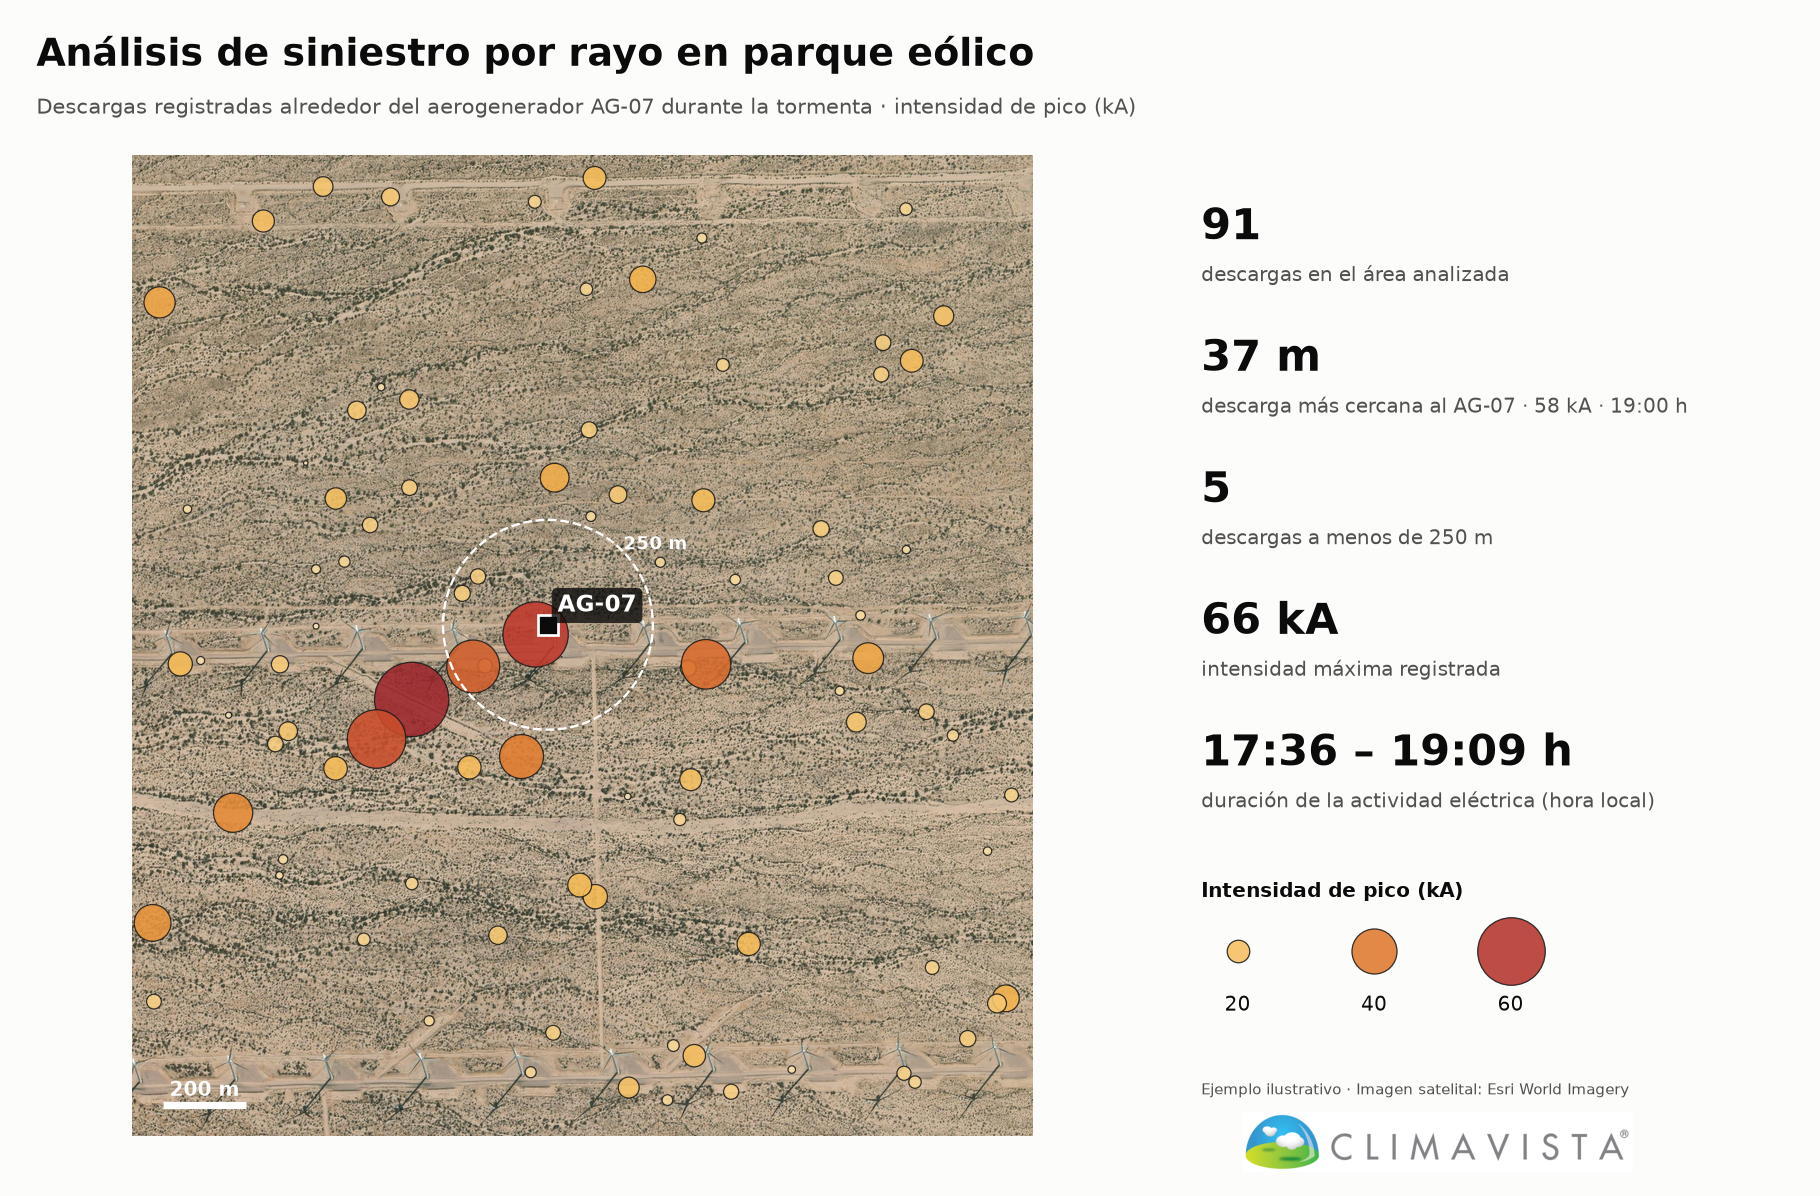
The same approach applies to electrical substations, warehouses, silos and fuel storage sites.
Building loyalty through quality information and personal follow-up
In insurance, contact almost always happens after the claim. The lightning alert reverses that moment: the insurer or the broker writes to the customer before the storm, with practical advice to protect their property. It is a regular, useful, low-cost gesture that makes the insurer a prevention partner rather than just a payer.
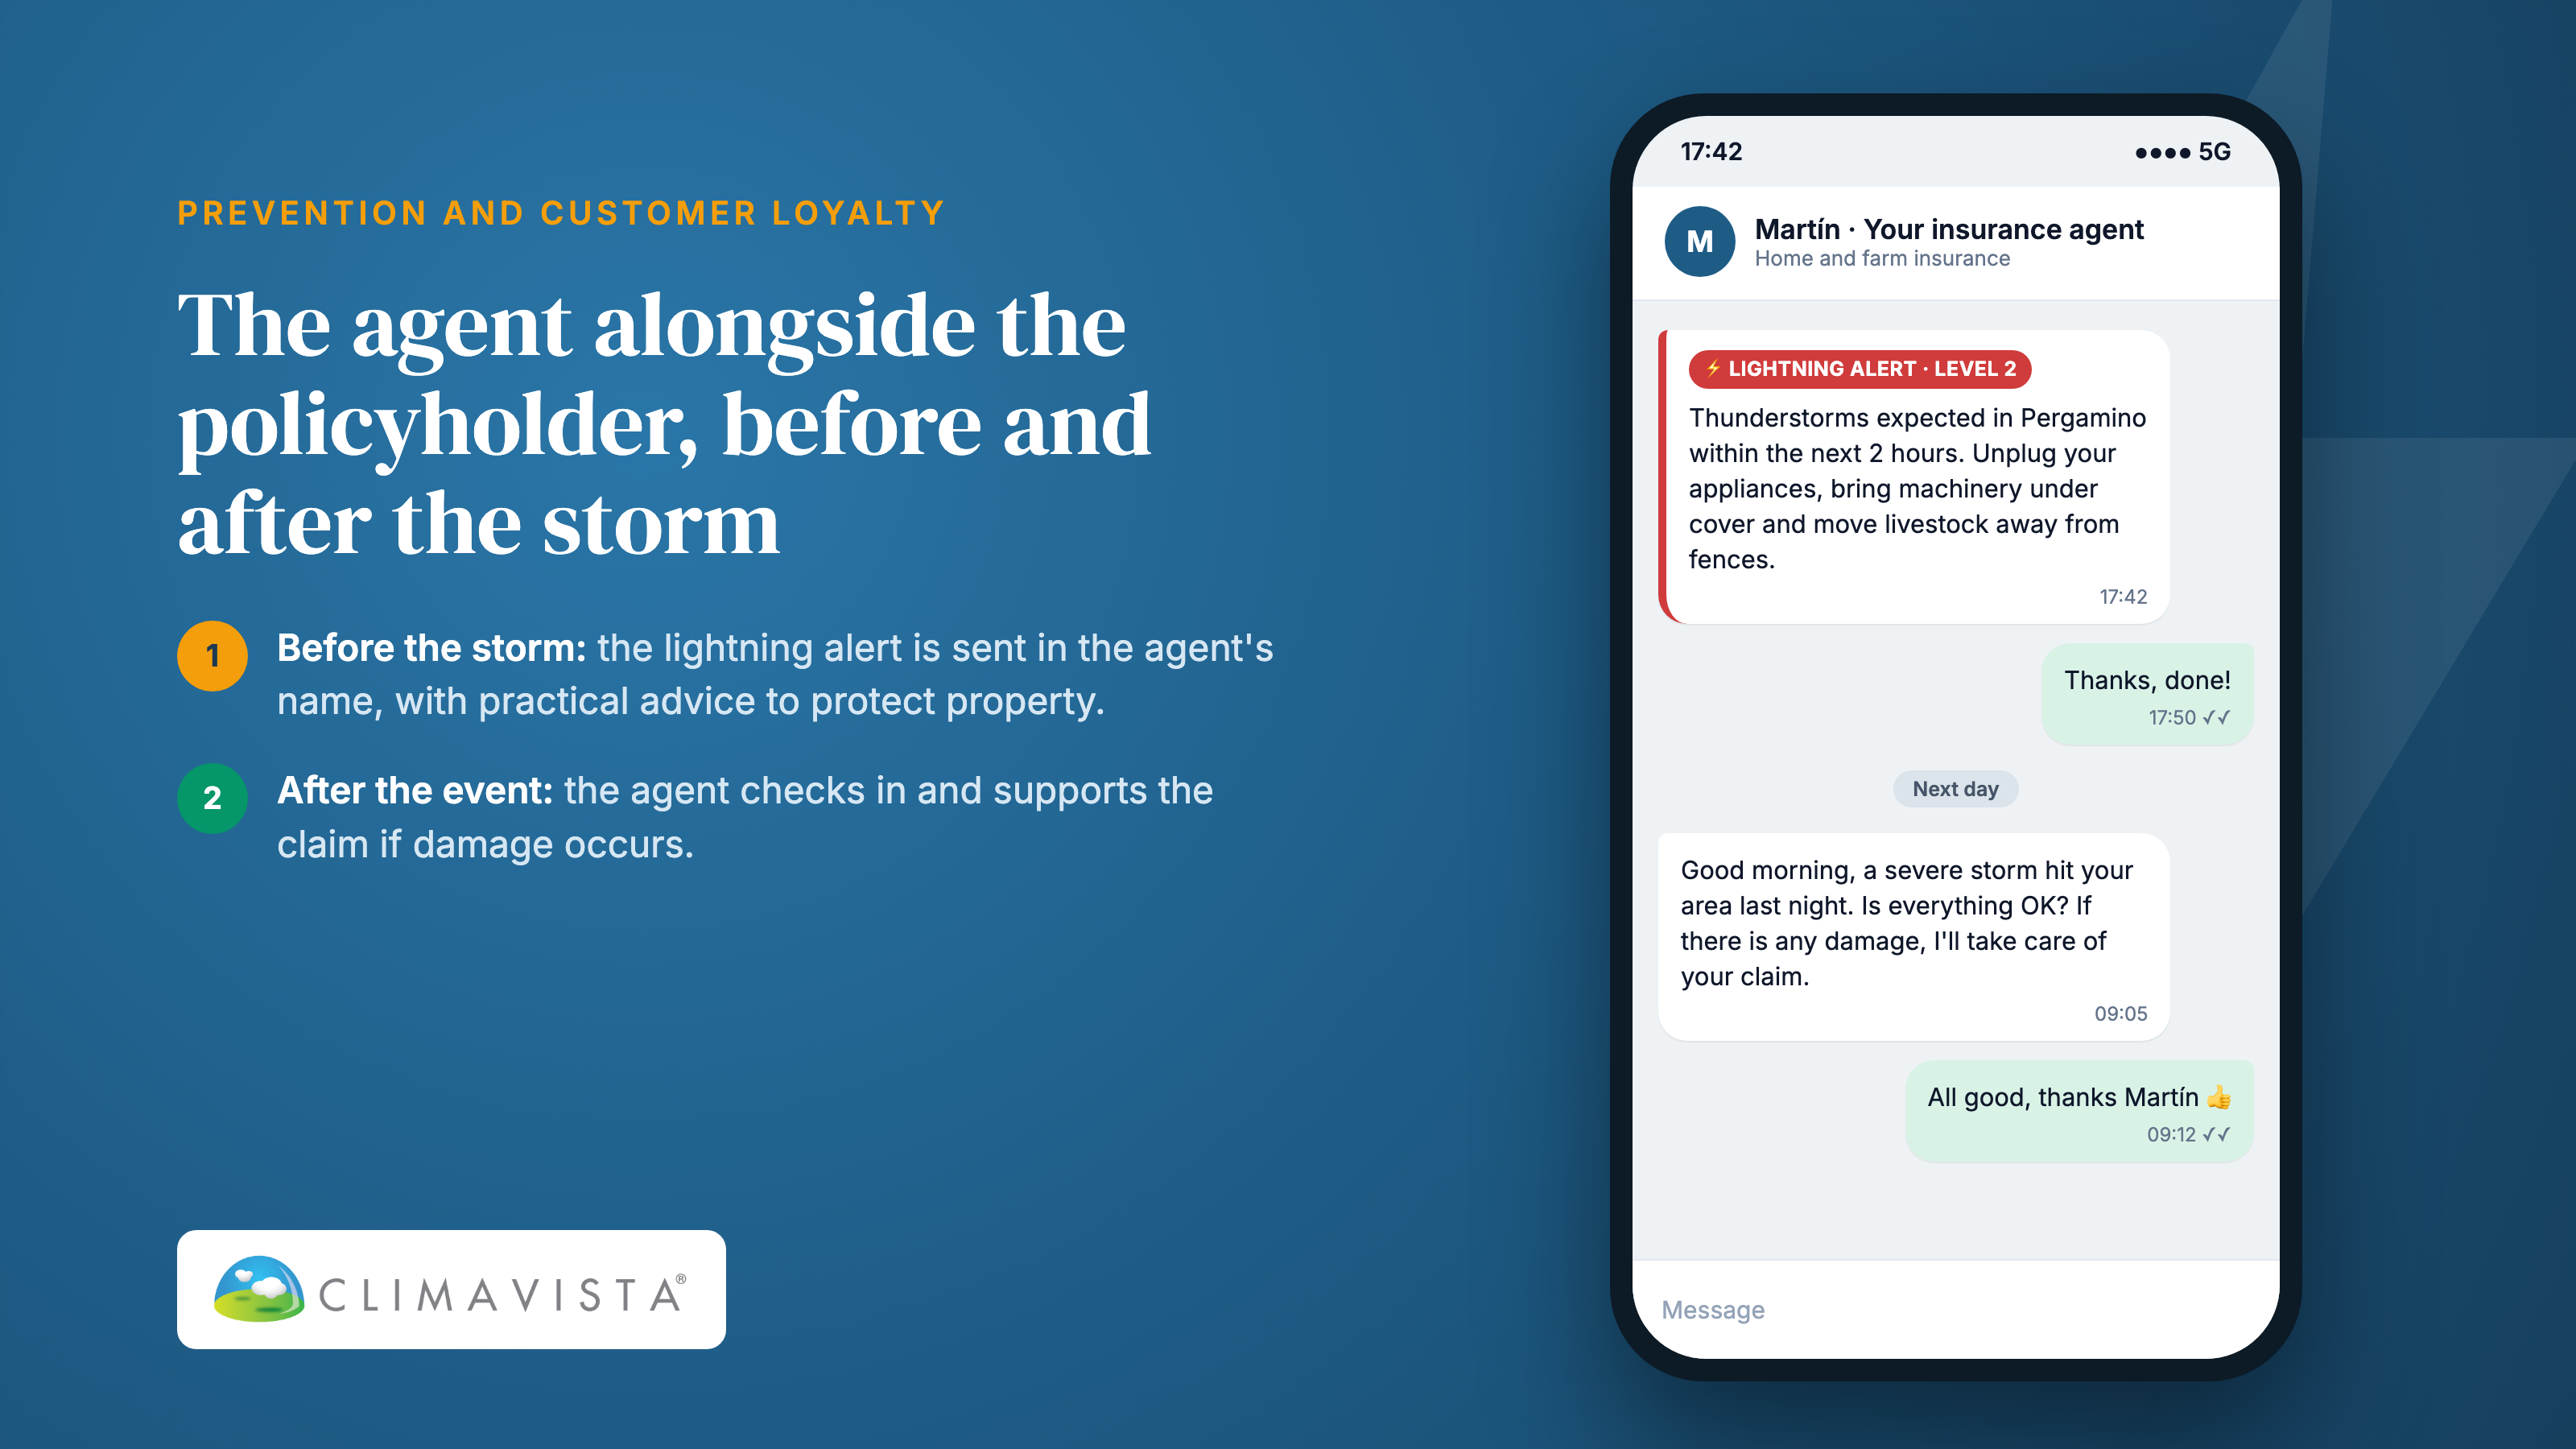
After the event, the same information enables personal follow-up. A broker who knows that a violent storm hit their customers' locality can call them even before they report damage: check that everything is fine, explain the process, speed up the claim. Information quality becomes a loyalty argument, and the broker becomes the customer's first point of contact when extreme events strike.
Calibrated in Argentina, adaptable to any country
The service was developed, calibrated and verified in Argentina, but the method is not tied to it: global forecast models, satellite-observed lightning, verification locality by locality. The GOES-19 satellite covers all of the Americas, and other geostationary satellites measure lightning elsewhere. In each new country, thresholds are recalibrated and alerts verified before going live; the figures published here apply to Argentina.
Key takeaways
Warning policyholders before a storm reduces damage: the European experience shows it, and it is a direct lever on the technical result. But the alerts need measured reliability. Verified continuously against observed flashes, our alerts today anticipate 60% of lightning days at 24 h and 67% of situations at 2 h across 20,000 localities. The same data then make it possible to check a claim, analyse a complex loss and support each policyholder after the event.
To see what these alerts would deliver on your portfolio, our teams can present the service on your own localities.