
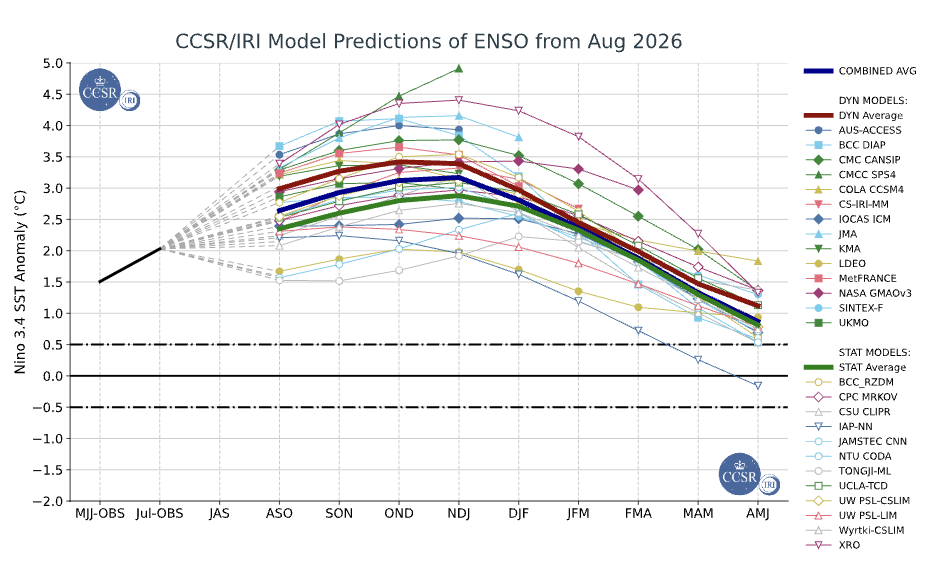
In 70 years of measurements, no El Niño has durably crossed the +3 °C anomaly mark in the Niño 3.4 region. Not 1982-83, not 1997-98, not 2015-16. Yet that is precisely the threshold that some seasonal model scenarios now place within the realm of possibility for 2026-27.
For an agricultural underwriter, a credit analyst or a risk director exposed to South America, the question is not whether the event will be "historic". It is knowing where, when and with what intensity it will shift losses — and how many months you have to act. This article walks through the reasoning from the ground up: what El Niño really is, how it is forecast, what history teaches us, and what it concretely changes for a South American portfolio.
Understanding: from a Christmas current to a tropical Pacific shift
Originally, El Niño was not a disaster. It was a miracle.
Along the Peruvian coast, fishermen observed every year, around Christmas, the arrival of a warm current coming from the north. With it appeared colourful fish, unusual tropical species, a suddenly different sea. This almost miraculous character, associated with the Christmas season, gave it its name: El Niño, the Christ Child.
But every two to seven years, something went wrong. The warm waters did not recede. They persisted for months on end, fisheries collapsed, torrential rains fell on coastal deserts. Scientists eventually understood that this was not a prolonged local anomaly: it was the coastal signature of a warming of the entire tropical Pacific. The name then shifted from the seasonal current to the extreme event — and that is the meaning we use today.
What actually shifts
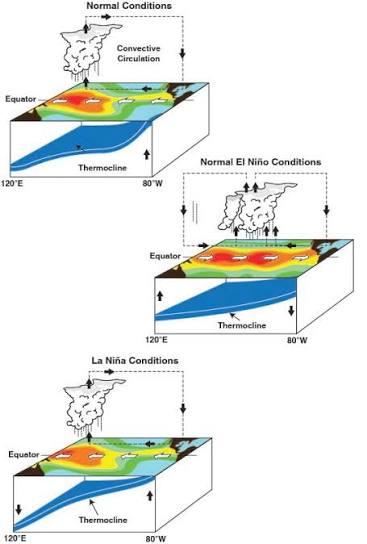
Under normal conditions, the trade winds push warm waters towards the western Pacific. Indonesia and northern Australia concentrate deep convection, and therefore rainfall. In the east, off Peru, cold waters rise to the surface (upwelling), feeding one of the most productive fisheries in the world.
When the trade winds weaken, this system reverses. Warm waters slide eastward, the thermocline deepens off South America, upwelling is stifled. And above all: convection zones move with the heat. Where it used to rain, it no longer rains. Where it did not rain, it rains too much.
El Niño does not add rain or drought: it redistributes rainfall on a global scale. That is why a single event simultaneously produces severe drought in one region and record flooding 2,000 km away. For a portfolio, it is a question of geography, not of averages.
La Niña, the mirror image
The opposite phase is just as structuring. When the trade winds strengthen beyond normal, cold waters spread across the central and eastern equatorial Pacific: this is La Niña. Convection shifts back to the west, and regional contrasts often reverse — drought where El Niño brought excess rain, and vice versa.
El Niño and La Niña thus form the two phases of a single oscillation, ENSO (El Niño – Southern Oscillation). Understanding one provides a reading grid for the other. A well-built portfolio does not hedge against El Niño: it is built to remain robust in both regimes.
Forecasting: what the indices actually say
ENSO forecasting does not rely on intuition. It relies on a small number of continuously monitored variables whose combination yields a remarkably robust signal at 3-6 months.
The sea surface temperature anomaly in the Niño 3.4 region (central equatorial Pacific) is the reference indicator. Its three-month running mean gives the ONI (Oceanic Niño Index), which is used to officially qualify an event: above +0.5 °C over five consecutive quarters, we speak of El Niño; above +1.5 °C, of a strong event.
Westerly wind bursts are a trigger. By opposing the trade winds, they send oceanic Kelvin waves eastward, carrying heat with them.
Thermocline depth is the reservoir. An abnormally deep thermocline in the east means that a considerable amount of heat is already in place beneath the surface, ready to emerge. It is often the best leading signal of the amplitude to come.
The spring predictability barrier. ENSO forecasts issued between February and May (boreal spring) are structurally less reliable: the system is then in an unstable transition phase. The most solid decision windows open from boreal summer onwards — precisely 3 to 6 months before the heart of the South American growing season. That is the window you need to know how to exploit.
Putting it in perspective: +3 °C, a boundary never crossed
This is where the 2026-27 scenario becomes interesting — and demands rigour.
Over the seven decades of usable tropical Pacific index series, three events dominate the "very strong" ranking: 1982-83, 1997-98 and 2015-16. Their ONI peaks all sit between roughly +2.1 °C and +2.6 °C. Even in raw monthly anomaly terms, the most extreme values in the series stop at around +2.9 to +3.0 °C.
In other words: +3 °C is not just another figure on a scale. It is a historical ceiling. Yet several seasonal model scenarios place the 2026-27 event in that upper zone, around +3.0 °C.
Two readings are required, and they do not contradict each other.
The first is prudential: models frequently overestimate event amplitude at long lead times, and an extreme scenario is not a central forecast. The role of an early warning system is not to sell a spectacular figure, but to track the convergence — or divergence — of the model spread month after month.
The second is operational: even if the event stabilises at +2.0 or +2.5 °C, it will sit in the upper quartile of the historical distribution. At that intensity level, the correlations between Pacific indices and South American rainfall anomalies become markedly stronger and more stable than in a weak regime. Paradoxically, a strong event is more predictable in its regional consequences than a moderate one.
A weak El Niño is noise. A strong El Niño is a signal. This is counter-intuitive for risk management, but it is good news: the years with the highest exposure are also those where anticipation is most reliable.
Impacts in South America: a geography of contrasts
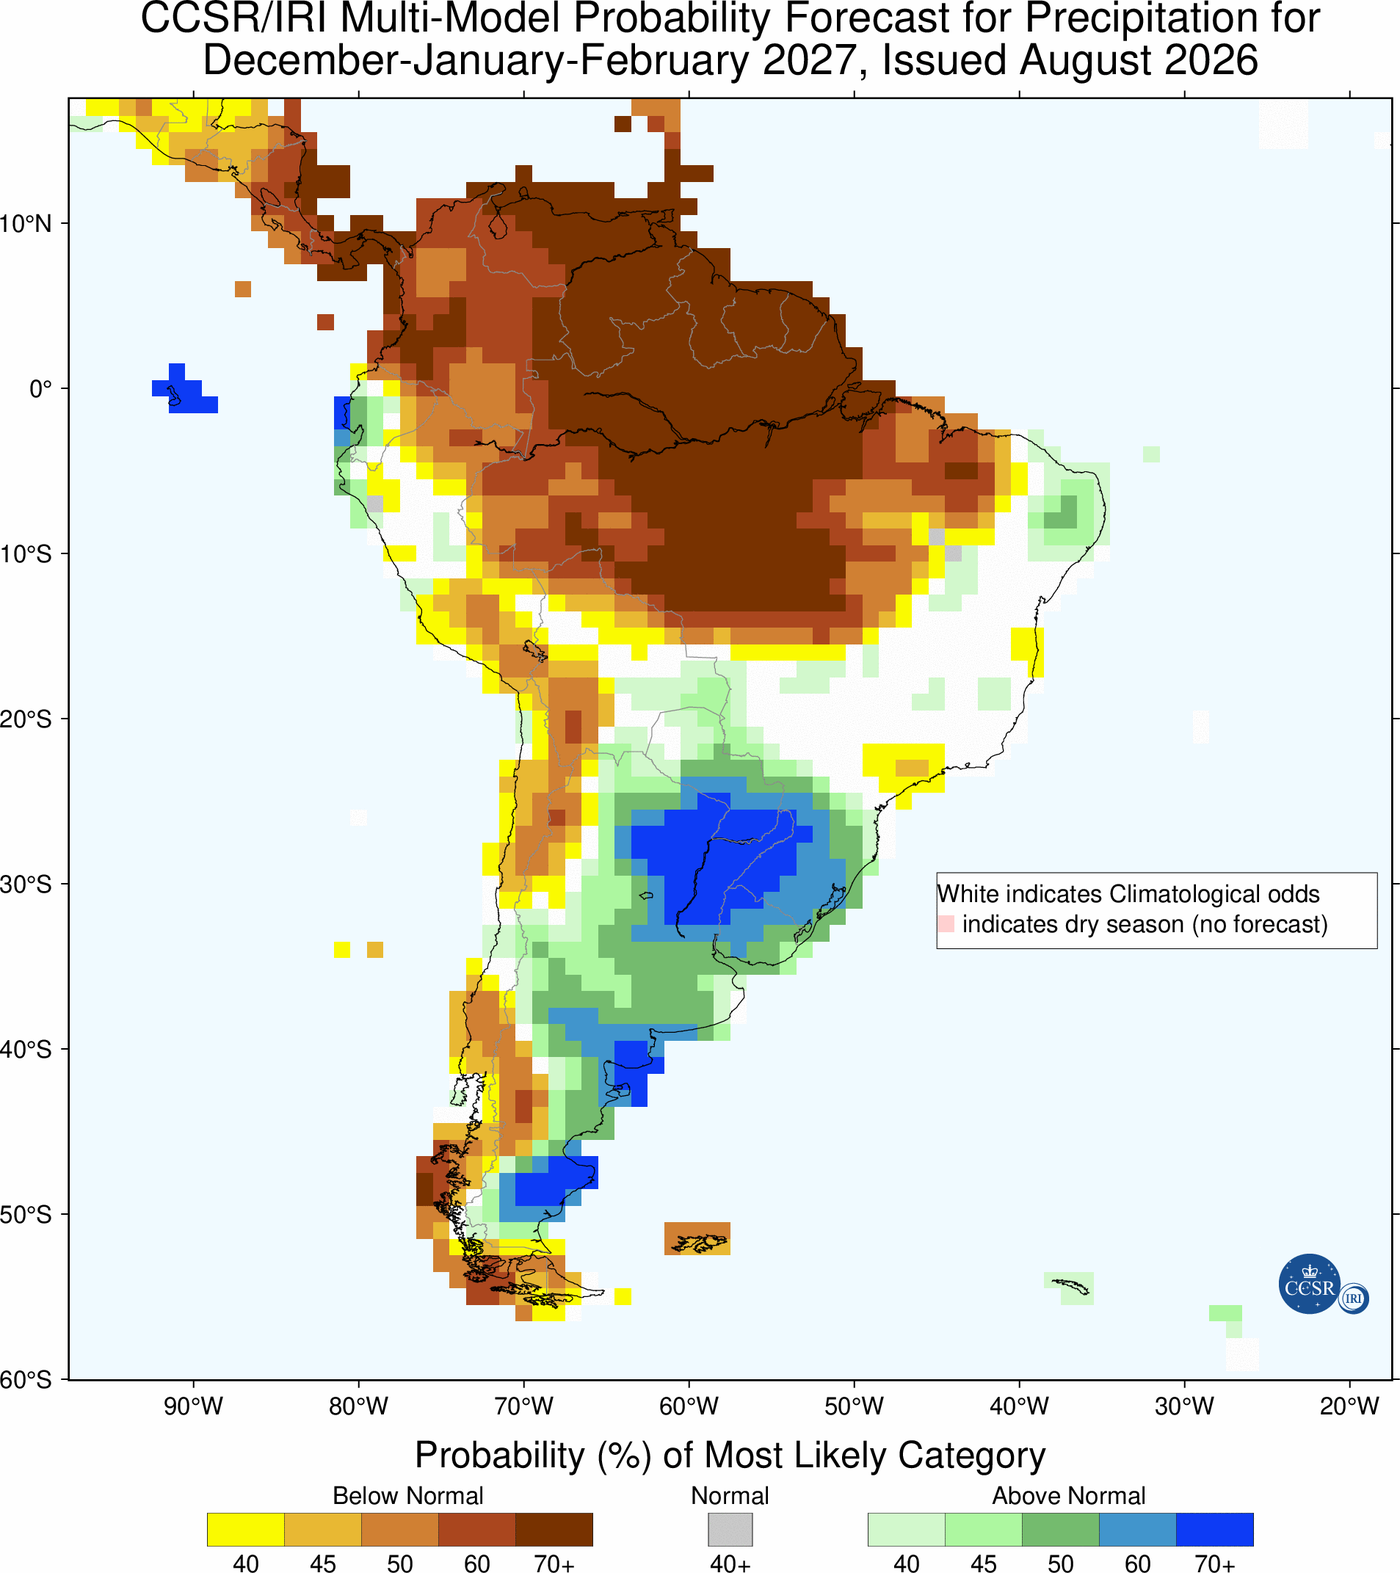
The South American continent is one of the areas where the El Niño signature is best documented — and most contrasted. The recurring patterns observed during strong events draw a readable map:
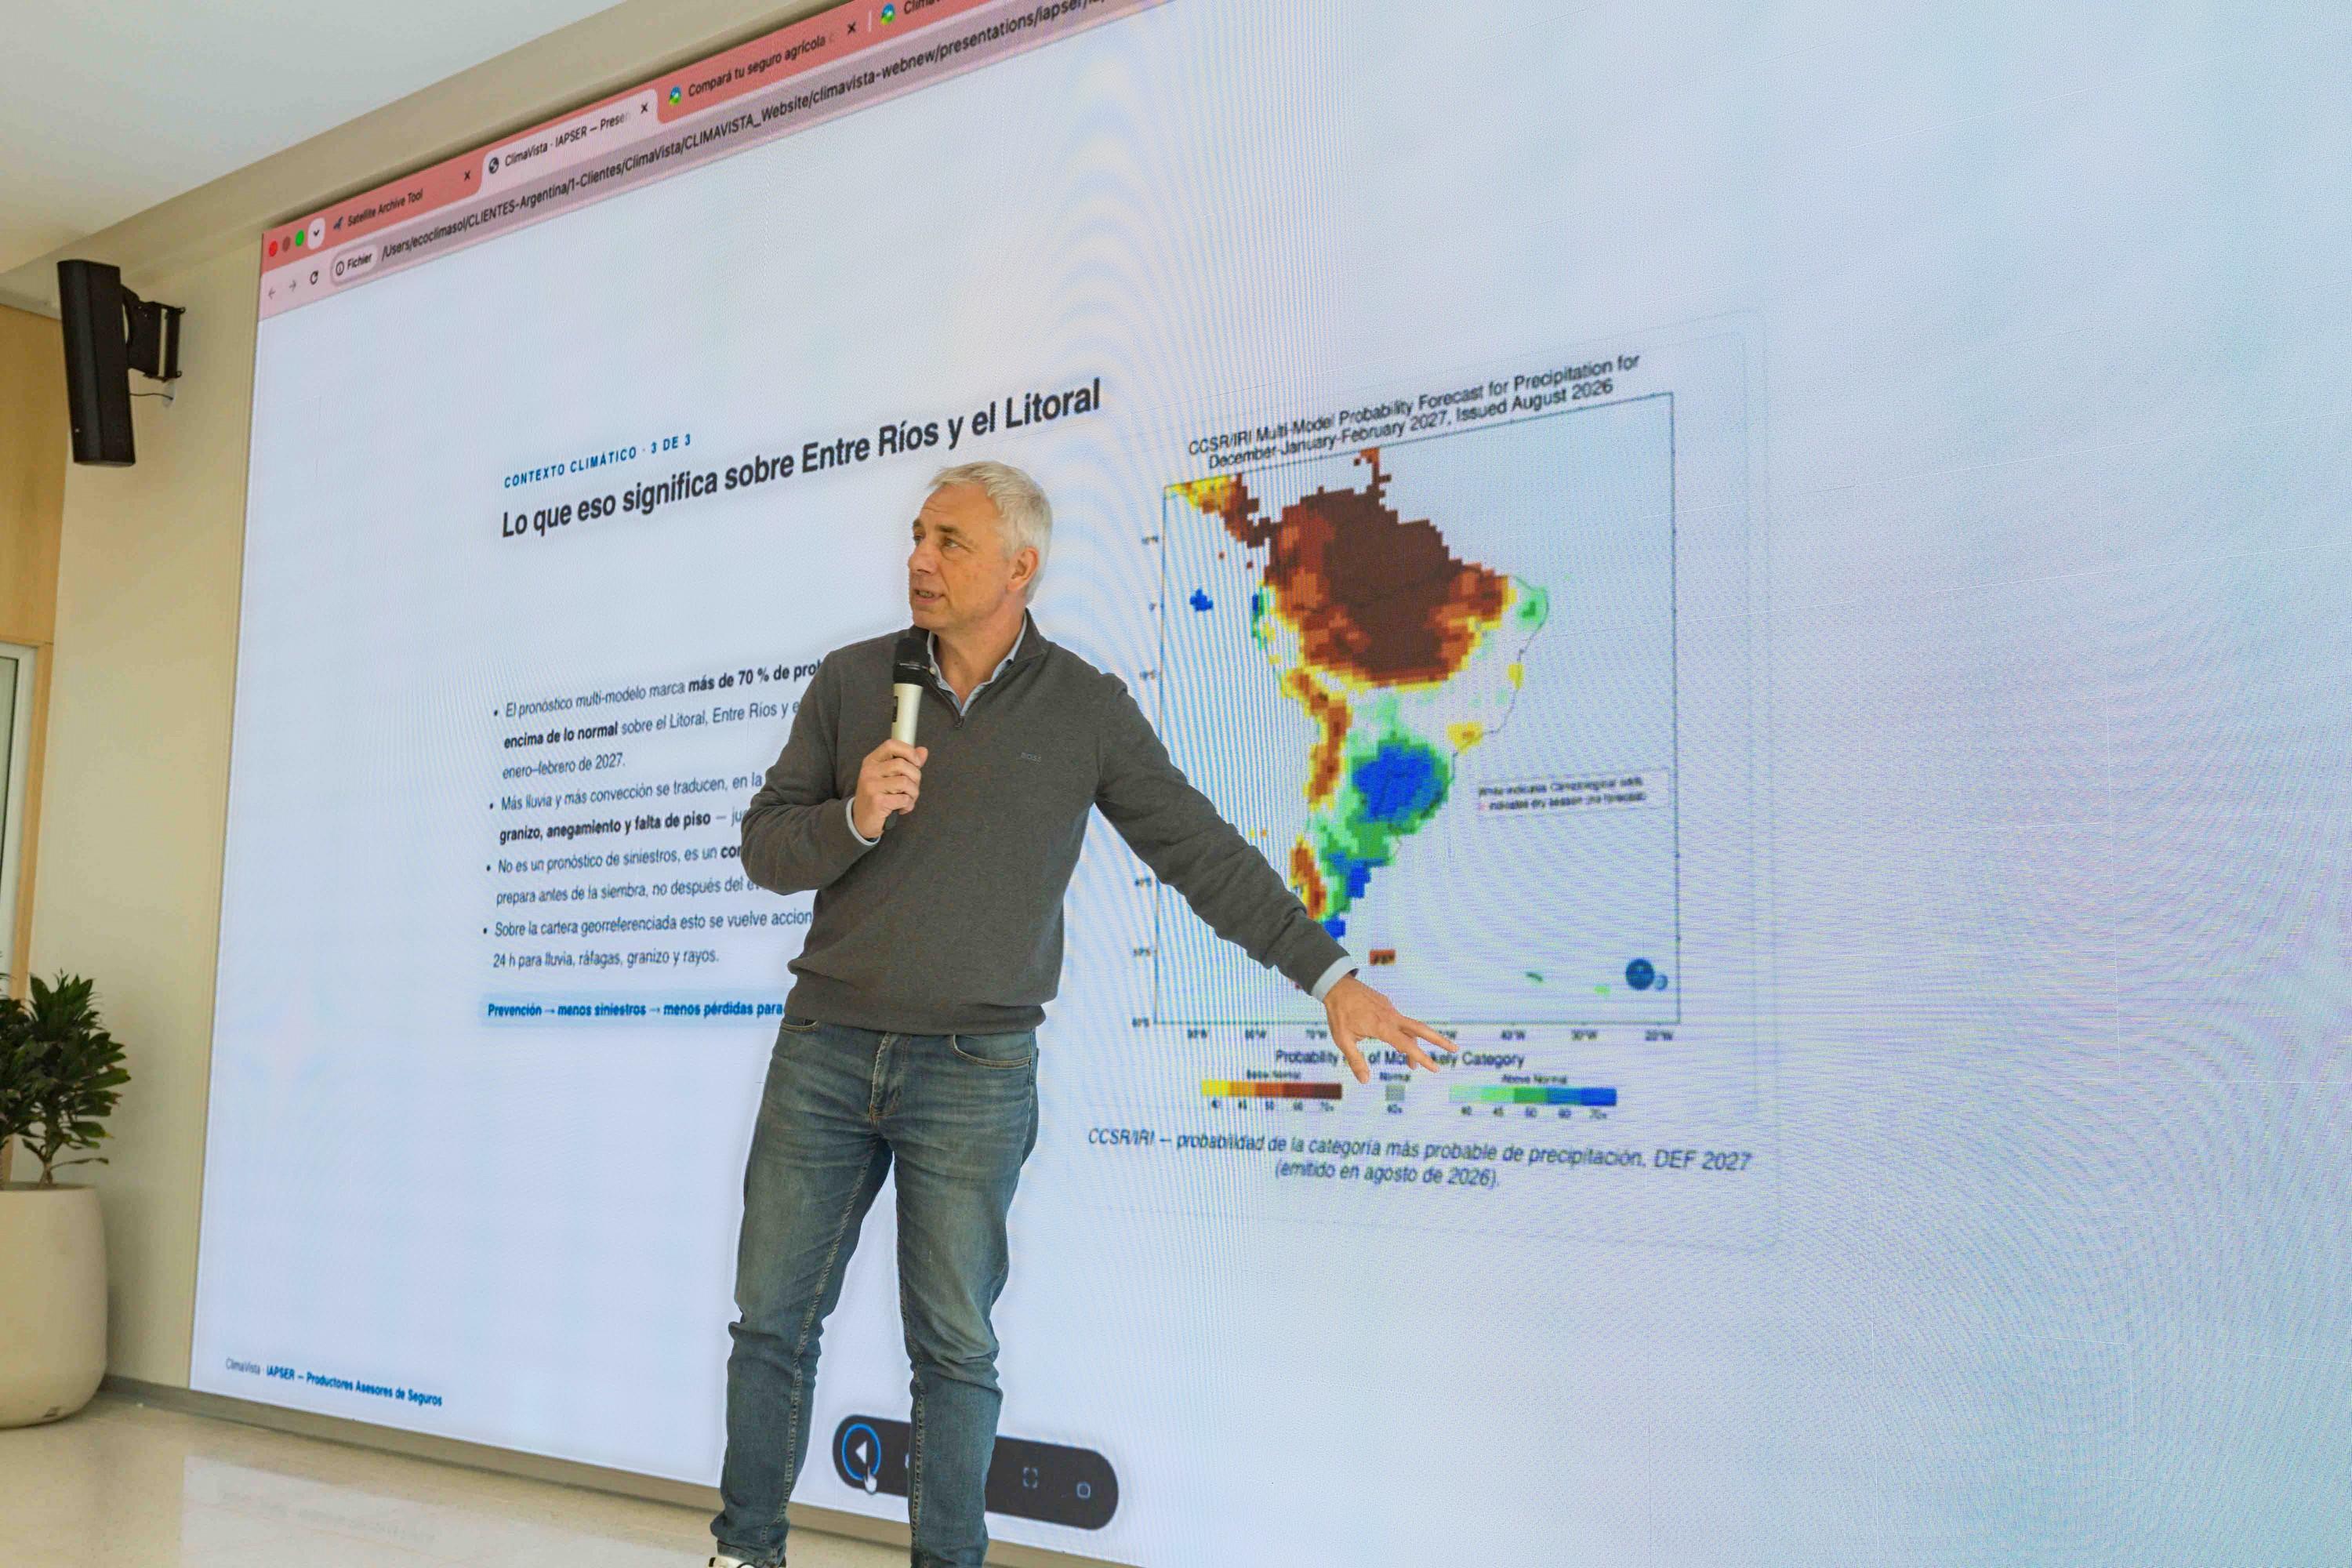
- Southern Brazil, Uruguay, north-eastern Argentina: marked rainfall surpluses, increased risk of flooding, hail and thunderstorms. Direct impacts on summer crops, logistics and property portfolios.
- Northern and north-eastern Brazil, Amazonia: rainfall deficit, water stress, pressure on yields and on river navigability.
- Tropical Andes, Colombia, Venezuela: dry tendency, with cascading effects on hydropower and perennial crops.
- Peruvian and Ecuadorian coast: intense rainfall over structurally arid zones, with a high risk of flash floods and a major impact on fisheries.
- Argentine Pampas: often a more favourable rainfall context than in La Niña years, but with intra-seasonal variability and a hail risk that remain significant.
These patterns are statistical regularities, not local certainties. Two El Niño events of the same intensity never produce exactly the same map: the exact position of the warming maximum (central or eastern Pacific), the timing of the peak and the state of the tropical Atlantic strongly modulate the outcome. Hence the need to work at portfolio granularity — department, growing area, field — rather than at continental scale.
From climate knowledge to decision-making
A generic ENSO bulletin does not make money. What matters is the full chain: from the oceanic index down to the portfolio line.
Concretely, this means three things.
Translate, don't relay. A 75% probability of a moderate-to-strong El Niño is not actionable information in underwriting. The useful question is: what is the probability that a given department records a rainfall deficit above its loss threshold, over the phenological window that matters?
Quantify on long series. Qualitative tendencies are not enough to price risk. You need risk statistics reconstructed over decades of satellite, station and reanalysis data, harmonised at portfolio granularity, and conditioned on the state of ENSO.
Monitor continuously. An El Niño is not a one-off event: it is a six- to twelve-month trajectory. The peak, its timing and its location evolve. Rebalancing decisions must be revisable month after month, not frozen on a September forecast.
The actionable takeaway
If you remember only one thing: the value of an ENSO signal lies not in its amplitude, but in the lead time it gives you.
Three to six months before the growing season, you can still adjust your risk-taking in the most exposed areas, calibrate your retentions and covers, tune the triggers of a parametric product, revisit the yield assumptions of a credit file, or open a prevention dialogue with your insureds. Three weeks before, all that is left is claims handling.
The 2026-27 scenario deserves close attention precisely because it sits at the edge of historical experience. Not to fuel alarmism — but because an event of this class shifts losses in a sufficiently structured way that one can prepare for it.
That is the purpose of our El Niño South America monitoring: continuous tracking of observed conditions and forecasts, identification of at-risk areas at your portfolio granularity, and risk statistics built on decades of tropical Pacific index series. If your South American exposure is significant, the useful window is open now.